A green dashboard is a claim about components
A green board means the components are up. Whether a user can finish the task is a question the system was never built to answer about itself.
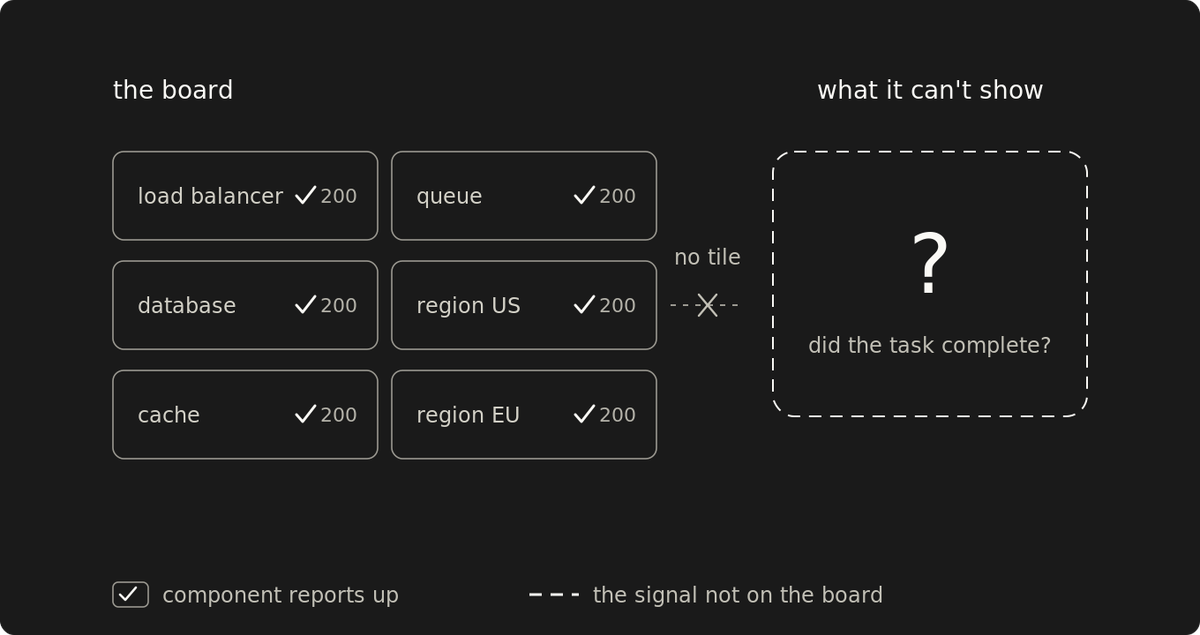
The board shows the load balancer answering and the database taking writes. The health checks return 200. The question you actually care about is whether a person can do what they came for, and the board has no tile for it. A 200 response from the monitoring service proves the component can respond to it. Whether a real request gets through, the way a user makes it, is what the board was never built to ask.
That signal, a completed task, has only two sources. You watch real users finish it, the requests they are already making, or you send a stand-in to walk the path when they aren't. Everything else on the board interviews the parts. None of it performs the task.
A component with no API is the ordinary case
Some components can't be polled at all—no API, no metrics endpoint, nothing to query. The reflex is to call that a monitoring gap, a system that resists being watched. It gets the situation backward. A component with nothing to poll is the ordinary case with the comforting shortcut removed. The surest way to learn whether it works is to use it the way a user does and check the result.
The trap is the synthetic check that stops at the connection. A check that opens a socket, receives a response, and flags it as green is still component monitoring: it confirms that a part answered, not that the answer was right. A service can return a 200 with stale data or yesterday's price, and a status code check waves it through. The check that works asserts on the value the user needed. It is also the expensive version. On an authenticated path, it requires real credentials and a standing identity, so you end up with a test account that gets locked out or triggers the fraud rules meant for humans.
When the component is the user
One case hands the job back to component monitoring: a component whose only consumer is another program. If the contract between them covers the correctness of the response, not just its shape, then checking the contract is checking the user. The user is a program. The API is the whole relationship. The gap reopens the moment a user sits downstream, or the path runs through what the contract never describes: the network in between, the steps no single component owns.
Multi-region is where the gap gets expensive
With one of everything, the distance between "the parts are up" and "a user can finish" is easy to ignore. Spread users across regions, and it stops being ignorable. They get routed to different places, and a board that rolls every region up to green can sit there green while a whole population can't complete the task at the region it landed on. Nothing pages, because every part in that region still answers its checks. The board is certifying the exact region where users can't finish the task.
So the signal has to come from where those users are: their real traffic in that region, or a stand-in reaching the region from outside your own network, the way they do. A check that runs from inside your infrastructure comes back green while the break sits between the user and the region, a stretch it never crosses. The cost of moving out there is that the stand-in inherits the edge's problems too. When it goes red, you have to tell a dead region apart from a probe that can't get out of its own network.
The stand-in fails silently
A stand-in is itself a system that breaks, usually for reasons that have nothing to do with what it watches: its credentials expire, its host fills up, its own dependencies fall over. When it breaks, it goes quiet, and quiet reads as healthy. The user-path result stays the signal you watch. Around it sits a guardrail: did the stand-in run at all? If no result lands in the window it should have, page on the silence. That guardrail has one thing to say: that the stand-in stopped reporting the user-path result; whether the system works is beyond its reach. It also misses the stand-in's other failure: a green reported off a broken assertion, the same false green a 200 gives—that one you catch only by testing the assertion itself.
Page on what users can't do
Alerting sorts the same way. The page that matters fires on a user-facing symptom: people can't finish the task. Where real traffic is heavy enough to measure, that symptom lives in the success rate of real requests, the error budget burning down. But success rate counts only the requests that arrive, so a population shut out at the edge never shows up in it. For unreachability, the symptom still has to come from outside-in, an edge probe or client telemetry. Where traffic is thin or a region sits empty, the stand-in is the symptom signal that still works—either way you page on the outcome, not on a busy CPU.
Some component alerts still earn the pager. The synthetic catches what a green board hides; a component alert catches the opposite blind spot: a part that is failing, or about to, before any of it has reached the user. A cert days from expiry, or a quota inching toward a hard limit, has no user-visible symptoms right up until the moment it takes the system down with it, and that runway is exactly when you want the pager. Those stay. A host drops and the pool carries the load; a CPU spikes and settles back. Both belong on a dashboard. Weight the pager toward the parts, and it fills with noise while the outage that counts still arrives by customer email.
The check that anchors the board goes red when a real task fails end to end, a real or synthetic user that couldn't finish. If it isn't on your board, that is the gap. Build it.
A board full of green tells you the parts are present. It takes a finished task out where the users are to tell you a person can actually use them.